
The association between teacher distress and student mental health outcomes: a cross-sectional study using data from the school mental health survey | BMC Psychology

Study design and data source
Data for this study comes from the 2014–2015 School Mental Health Survey (SMHS) [24] – a cross-sectional study that included 248 schools across Ontario, Canada. Schools were selected based on the sampling design of the Ontario Child Health Study, a companion study of the epidemiology of child and youth mental health in the province of Ontario [25]. Selected schools were no different from schools not selected on the basis of school type, school level, language, region, enrolment size, proportion of English Language Learners, standardized achievement levels, and sociodemographic characteristics derived from the National Household Survey and the Census. Among those schools selected, 60% agreed to participate. Once a school agreed to participate, all teachers and students in grades 6–8 were invited to participate. In secondary schools, a random sample of three classrooms per grade (grades 9 to 12) was selected, and students and teachers from those classes were invited to participate. In total, 31,124 students participated (student response rate was 62%) and 3,373 teachers from kindergarten to grade 12 (teacher response rate was 73.5%).
The sample for analyses in the present study included 23,568 students whose teachers completed the teacher survey and had complete mental health data (75.7% of all students completing the SMHS).
Among teachers, 1,509 were eligible to be included in this study since they taught grades 6 to 12. Kindergarten to grade 5 and special education teachers were not eligible to be included in this study since students in their classrooms did not complete corresponding surveys measuring their mental health. About 2.0% (n = 31) of teachers had missing responses on the psychological distress measures and were removed, resulting in a final sample of 1,478 teachers (Fig. 1).
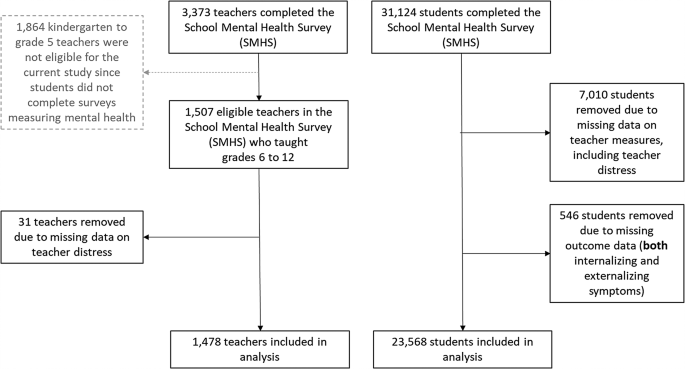
In total, 3,372 teachers completed the School Mental Health Survey (SMHS). Only teachers who taught grades 6 to 12 were eligible to be included (n=1,507). An additional 31 teachers who were missing data on the measure of teacher distress (independent variable), were removed. This left a total of 1,478 teachers eligible to be included in the current study. In total, 31,123 students completed the SMHS. 7,010 students were removed who had a teacher missing the teacher distress measure (independent variable). An additional 546 students were removed who were missing both outcome measures (internalizing and externalizing symptoms). This left a total of 23, 568 students eligible to be included in the current analysis
Student mental health outcomes (internalizing and externalizing symptoms)
Internalizing symptoms
To measure internalizing symptoms, a modified subset including nine items from the Ontario Child Health Study Emotional Behavioural Scales (OCHS-EBS) was used [26]. Students were asked about feeling unhappy, sad or depressed; moody or irritable; having no pleasure from usual activities; feeling overtired or a lack of energy; feeling worthless or inferior; fearful or anxious; finding it hard to stop worrying; anxious or on edge; or nervous or tense. They were asked to select the response that best describes them now or within the past six months. Response options included [1] never or not true, [2] sometimes or somewhat true, [3] often or very true. Scores were summed and ranged from a minimum of 9, indicating low internalizing symptoms, to 27, indicating high internalizing symptoms. Within the SMHS sample, the scale had high internal consistency among elementary (α = 0.89) and secondary students (α = 0.91) [9].
Externalizing symptoms
A modified OCHS-EBS scale with 13 items was used to measure externalizing symptoms [26]. Students were asked about losing temper; arguing with adults; acting defiant or talking back to people; feeling angry or resentful; having feelings of wanting to get back at people; threatening to hurt people; physically attacking people; getting into fights; damaging schools or property; acting disobedient at school; using weapons when fighting; stealing things from places other than home; and having broken into someone else’s house, building, or car. Participants were asked to select the response that best describes them now or within the past six months. Response options included [1] never or not true, [2] sometimes or somewhat true, [3] often or very true. Scores were summed and ranged from 13 to 39, with a higher score indicating higher externalizing symptoms. This scale has been found to have high internal consistency among elementary (α = 0.87) and secondary students (α = 0.88) [9].
Independent variable
Teacher distress
Teacher distress was measured using the Kessler Psychological Distress Scale (K6). This 6-item scale is widely used in epidemiological surveys as it is a brief tool that is both valid and reliable [27]. Teachers were asked, “During the past 30 days, how often do you feel the following: nervous; hopeless; restless or fidgety; depressed that nothing could cheer you up; that everything was an effort; worthless?”. They were given the following response options: [0] None of the time; [1] A little of the time; [2] Some of the time; [3] Most of the time; [4] All of the time. Possible scores ranged from 0 to 24. Within the SMHS, teacher distress had a Cronbach’s α of 0.86, indicating high internal consistency. Teacher distress was modelled at the classroom level (level 2).
Individual/student-level variables
Gender
Students were asked to identify as [0] male or [1] female.
Age
Students were asked to report their age in years. The mean age for elementary students was 12.2 years (SD = 1.05), and for secondary students was 15.5 years (SD = 1.46).
Race and cultural group. Participants were asked, “Which category best describes your race or cultural group?”, with the option to select more than one category. To ensure a sufficient sample size within each category, racial and ethnic groups were collapsed into the following groupings: White (reference); East Asian, Southeast Asian, or South Asian (Asian); Black African, Black Caribbean, or Black Canadian or American (Black); or Other/Multiracial (including West Asian or Arab, Latin American, Central American, South American, Aboriginal/Native, Other, or Multiracial). White youth were chosen as the reference group as they represented the largest proportion of the sample.
Family assets
Family assets were measured using a modified version of the Family Affluence Scale [28, 29] from the Health Behaviour in School-Aged Children Survey [30]. Students were asked to report how many of the following their family owned: [1] a car, van, or truck; [2] a desktop computer or laptop; [3] a cell phone and a tablet; [4] an e-reader or iPad. Response options were on a 4-point scale: none, 1, 2, 3 or more. To reduce the number of variables entered into the analysis and to develop a standardized z-score, principal component analysis was used. A single component emerged, accounting for 45.5% of the variance.
School safety
To measure school safety, a scale was derived from the Survey of Chicago Public Schools Elementary School Student Edition [31]. This scale asked students to report how safe they felt in five school environments, including: hallways/stairwells; bathrooms/changes rooms; outside/around the school; on way to/from school, and in classes. Response options included: [1] not safe; [2] somewhat safe; [3] mostly safe; [4] very safe. Scores ranged from 5 to 20, with higher scores indicating higher feelings of school safety. Cronbach’s alpha for this scale was high (α = 0.86), indicating good internal consistency within the SMHS.
Classroom-level variables
Classroom size
Teachers were asked to report how many students were enrolled in their class. Classroom size was treated as a categorical variable with response options [1] 1–5; [2] 16–20; [3] 21–25; [4] 26–30 (reference); [5] ≥ 31.
School level-variables
School socioeconomic status
Information was derived from the National Household Survey 2011 [31] to measure school socioeconomic status. A weighted mean of median family income by postal code was used, whereby postal codes with more students were weighted more heavily than those with fewer students. An average for each school was estimated. Median family income is presented in increments of $1000.
School urbanicity
Depending on where schools were located, they were coded as urban [0] or rural [1] using the school postal code.
Statistical analysis
All statistical analyses were conducted using SAS 9.4 [32]. To determine the association between teacher distress and student mental health outcomes (internalizing and externalizing symptoms), a three-level (school, classroom, student) multivariable linear regression model was fit for each outcome. Separate models were run for elementary (grades 6–8) and secondary schools (grades 9–12). Random intercepts were included in the model for classrooms and schools, and all remaining covariates were included as fixed effects. To determine model adequacy, model assumptions were explored (including linearity, homoskedasticity, and collinearity). PROC GLIMMIX was used to calculate unstandardized coefficients (b) and 95% confidence intervals (CIs). A second model was run where the main effect for school safety and the interaction term for school safety and teacher distress were added to understand how this variable modified associations. A complete case analysis was conducted as all variables had less than 5% missing. Standardized models were also run using the PROC STDIZE function in SAS (Appendix Tables A2 and A3).
link


